Buying after the easy move.
Put statistical stretch zones and mapped GEX levels on your chart before the move. Know where you want to see a response instead of chasing the next candle.
See the overnight mapNQ FUTURES · LEVELS, ENTRIES & CONTEXT
Price is only the surface.
Give your NQ entries more than a moving candle. Combine 1-minute displacement, statistical session levels and overnight GEX—and learn the workflow in our interactive Academy.
5 stars on WhopNQ / MNQ workflow Academy included · Member sign-in required
Chasing NQ, fading a strong move too early, or changing your rules after every loss can leave you reacting to candles. Put a repeatable process behind your decisions.
Put statistical stretch zones and mapped GEX levels on your chart before the move. Know where you want to see a response instead of chasing the next candle.
See the overnight mapA stretched price can keep running. Use displacement at your session and GEX levels to judge the response before assuming a reversal.
Read the responseWork through preparation, entry context and review in the interactive Academy. Use the lessons and chart examples to build a workflow you can repeat.
Open the member AcademyOptions positioning.
Context behind price.

Add positioning and participation to decide what deserves your attention.
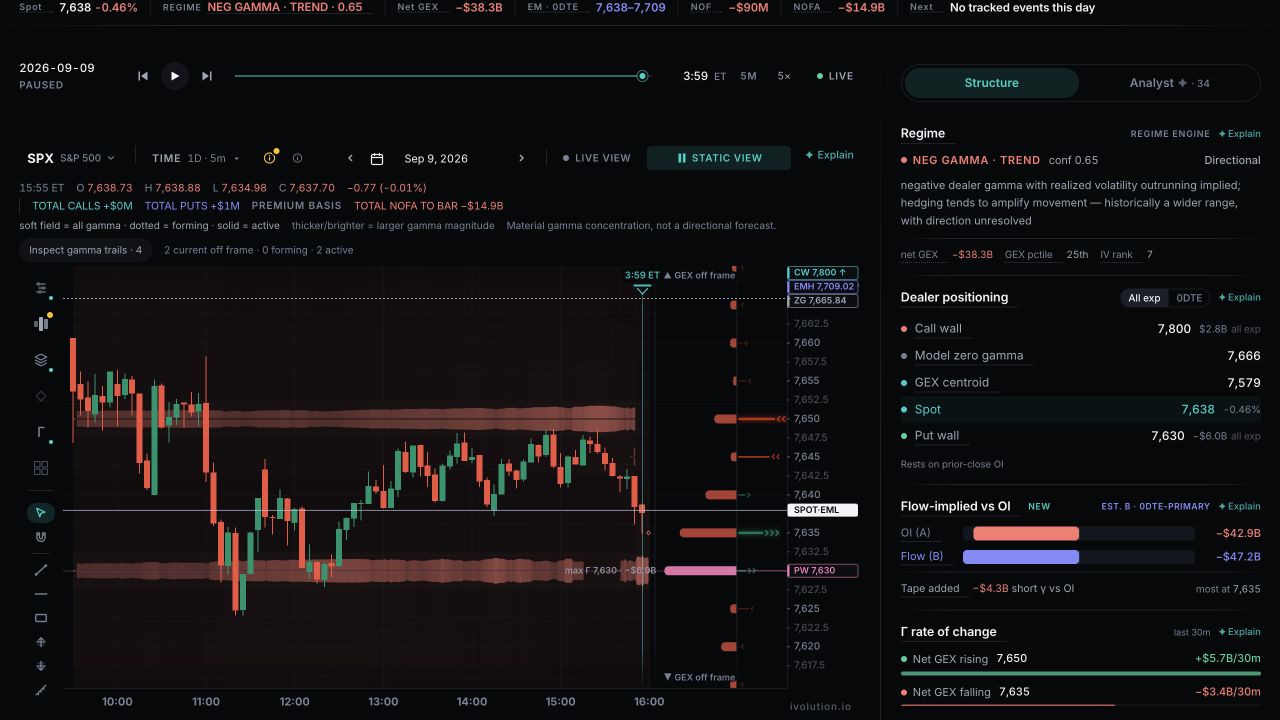
In this SPX session, price revisited the lower gamma trail and rebounded. Later advances approached the upper trail before pulling back.

Follow the strength of the level. Trail thickness and brightness show how gamma changed as the session developed.
Build a plan around the response. Compare a touch, rejection or break with the positioning behind it.
Selected historical example. Levels can be crossed. Past reactions do not guarantee future results.Check the level, the participation,
and the price of the trade.
See large options trades, net flow and aggressive orders together. Judge whether price follows that activity or stalls at your level before joining the move.
Net Options Flow · Large trades · Activity tape
Absorption is inferred. Underlying orders: SPY / QQQ.
Follow live estimates of dealer positioning as today’s options flow develops. See where exposure is shifting, so you can reassess the levels behind your trade.
Standing inventory compared with flow-adjusted exposure.
Modeled exposure · All expiries and supported 0DTE views
Model how dealer buying or selling could change with price, volatility and time. Check whether hedging could reinforce your thesis or push against it.
Price, volatility and time sensitivities in one view.
Gamma · Vanna · Charm · Modeled hedge demand
An option can lose even when price moves your way. Compare volatility, expected move and repricing to understand what you’re paying for before you buy.
Expected Move · Implied versus realized volatility · Options pricing
Expected Move · IV / RV · Skew · Repricing
Compare gamma concentrations across SPX, SPY and QQQ in one view. Check whether your level has a counterpart across the market without stitching separate charts together.
Compare gamma concentrations across SPX, SPY and QQQ.
Cross-market Confluence · Preview
Replay price, gamma trails and flow together. Study what was visible before the reaction, then review the decisions you’d make with that information.
 View full capture
 SPX · Sep 9, 2026 · Recorded replay at 3:59 PM ET
Bring positioning, flow and session changes into one concise read. Terminal includes the rules-based Session Read; Terminal + AI adds analyst chat and panel Explain access.
Session context and AI access pending activation verification.
AI access is included in Terminal + AI; live generation is pending activation verification. Usage limits apply.
AFTER HOURS GEX
Carry cash-close NDX and QQQ gamma levels onto NQ and MNQ. Plan where to watch for reactions overnight, with an options-positioning map beside your futures chart.

Use mapped walls, gamma strikes and model zero gamma to choose where to watch price react.
The cash-close snapshot stays fixed as futures move. Evaluate each approach to a level against the same positioning reference.
Paste the Terminal snapshot into IVOLUTION’s TradingView overlay. Keep your levels, candles and charting workflow together.
Use 1-minute displacement to read the response at your levels. Add statistical session context and After Hours GEX to understand where that response is happening.

Statistical session zones highlight extended price. Use them to assess possible reversion setups and choose where to wait for a response.
See the levels in action
Highlight strong 1-minute NQ candles around your GEX and session levels. See whether price drives through an area or moves sharply away from it, then assess the entry in context.
Explore the combined toolkitSelected examples with the creator’s original annotations. They illustrate a workflow, not verified trade results.
Learn the workflow in the member Academy Interactive lessons, chart examples and reference guides. Membership sign-in required.
IVOLUTION MEMBERS
Feedback on our education and indicators.
Learning material
well written for the average trader to learn and level up from.
Learning through paper trading
learn chart reading and trade execution.
Indicator usability
Easy to use and follow.
Selected excerpts from member reviews on Whop.
PREPARE FOR YOUR NEXT SESSION
TradingView tools for NQ, the interactive Academy, Terminal context and community—together.

Your NQ workflow: displacement entries, statistical session context and After Hours GEX, backed by the Terminal, Academy and community.
Secure checkout and membership management on Whop
AI is not included in this plan. Terminal beta; coverage varies by symbol and captured data.
Everything in the futures system, plus the full research library and AI access. Live generation is pending activation verification.
Secure checkout and membership management on Whop
AI access is included; live generation is pending activation verification. Usage limits apply.
Review the current price, renewal terms, and included access at checkout.
NQ futures traders who want a repeatable way to connect displacement entries, statistical session context and After Hours GEX. The Terminal also serves SPX, SPY and QQQ options traders with positioning, flow and volatility tools. Mapped overnight levels support NQ and MNQ.
The main chart and product diagrams are labeled illustrations. Replay and the dated chart examples use actual product captures. This website does not display a live market feed.
The $97 Terminal membership includes the three core TradingView indicators, interactive Academy, community and Terminal market context. Terminal is beta; Cross-market Confluence is in preview. Session Read uses a rules-based summary. The $147 Terminal + AI plan adds the research library and AI access; live generation is pending activation verification. Usage limits apply.
No. Levels can attract price, see a response, or be crossed. Positioning is modeled, not direct knowledge of dealer inventory. Use the tools to frame scenarios and evaluate the evidence alongside your own risk management.
Choose your membership, complete checkout on Whop, then follow START HERE – Futures to claim your indicators and open the member Academy. TradingView indicators require setup; GEX overlays use a manually pasted Terminal snapshot. Billing and subscription management stay in Whop.